
Views
Who looked at the asset, when, and from where in the library or a share.
Analytics & insights
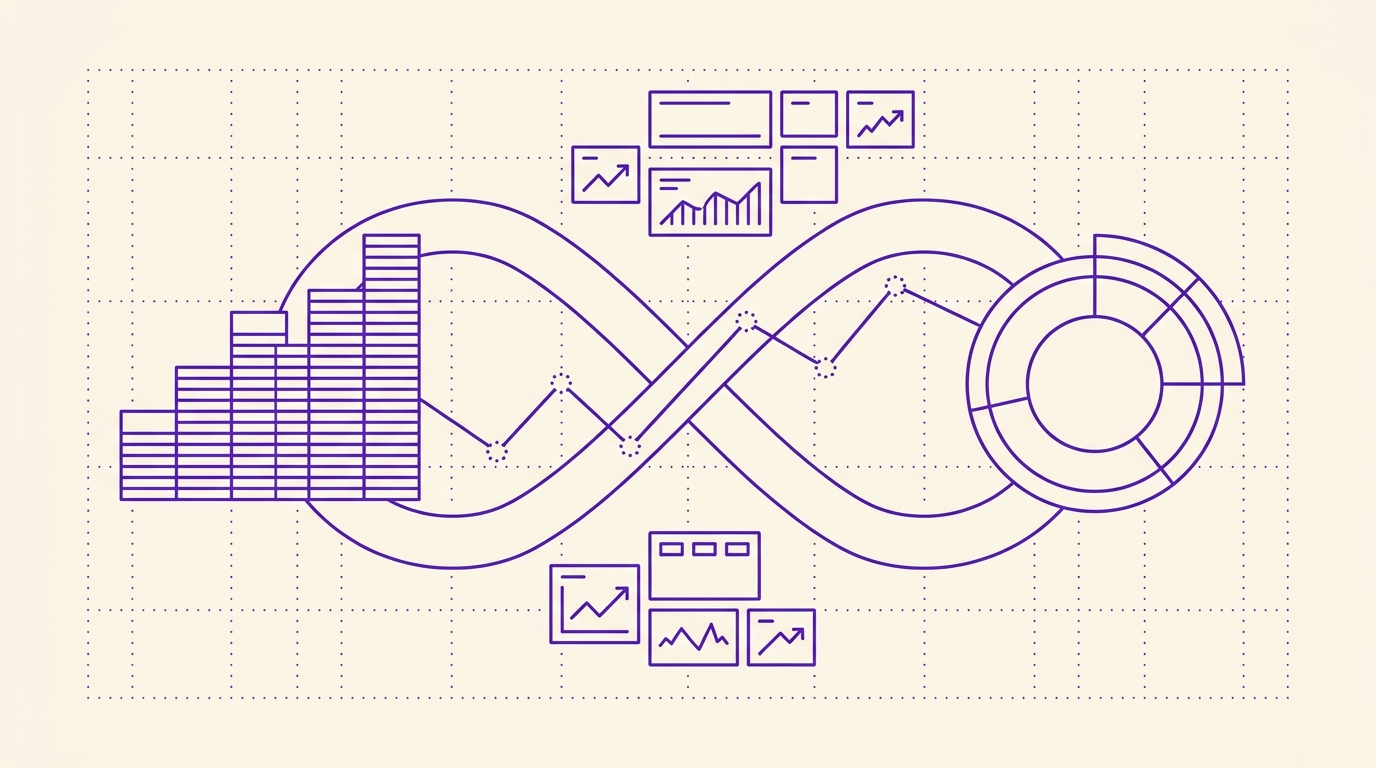
Freedam quietly measures every view, download, share, and search your team generates, then turns it into the answers marketing leaders already need on Monday morning. No data team, no spreadsheet exports, no guessing.
Most DAMs end at “file uploaded”. That's where the interesting questions start.
The blind spot
"Which photos from last quarter's shoot actually got used? And which ones cost us €40k for nothing?"
What Freedam shows
Every asset carries its own performance story, views, downloads, shares, the search queries that surfaced it, the people who picked it up. Filter by campaign, date, contributor. See the winners and the ghosts side by side.
The blind spot
"Half the team searches for things we don't have. They give up, then ask the agency for something we already own, under a different name."
What Freedam shows
Top searches and zero-result searches are tracked the moment they happen. You see exactly what your team is asking for, what came up empty, and which content gaps to brief next.
The blind spot
"Did the launch deck we sent the regional teams actually get opened? Or did it die in someone's inbox?"
What Freedam shows
Every share link has its own dashboard, visits, downloads, conversion rate, peak hours, devices, geography. You know in minutes whether the asset landed, or where it stalled.
The blind spot
"Sales just asked for our top-performing visuals last quarter. I have a Slack message and a gut feeling."
What Freedam shows
A trending and top-performers list is one click away, ranked by views, downloads, or shares, over any window from a week to a year. Export it to CSV and send it before the meeting.
The blind spot
"Our storage bill keeps climbing and nobody can tell me what we're paying to keep around."
What Freedam shows
Orphan and dead-asset reports flag what hasn't been touched in months, with the storage they're consuming. Reclaim space, or archive with confidence.
Open any file and see exactly how it's pulling its weight. Not aggregate library stats, the specific photo, the specific video, the specific PDF.
Asset performance · last 14 days
2026 Spring Herocampaign asset
Views
2,455
+38%
Downloads
462
+22%
Shares
111
+19%
Who looked at the asset, when, and from where in the library or a share.
Every download, internal team, agency, brand portal, share link, counted.
Which assets ended up bundled in shares to clients, partners, and regional teams.
The exact queries that surfaced this asset, your team's natural language for it.
How often people open the asset after seeing it in a result list. The "earn its keep" number.
Distinct viewers and downloaders, not just raw counts. Reach, not noise.
Freedam classifies every asset into one of four lanes, automatically, every night. By Monday morning you know where to spend your attention, your budget, and your next shoot.
Filter by date range, by collection, by contributor, by asset class. Export the list to CSV and walk into the meeting with the answer.
Your bestsellers, the assets earning the most attention right now. Promote them, license more like them, brief the next shoot from them.
Assets gaining steam over the last few days. Catch the trend early, boost it on social, push it into the next campaign.
Once-popular assets that have gone quiet. A signal to refresh the angle, retire it, or check whether visibility broke.
Files nobody has touched in months. A storage cleanup candidate, or content nobody knows exists yet.

What your team types into search is what they actually need. Freedam captures it all, the queries that hit, the ones that came up empty, the filters people keep reaching for.
Last 30 days · top searches
LiveThree of the top six queries returned zero matches. That's not a search bug, that's your next content brief, written for you.
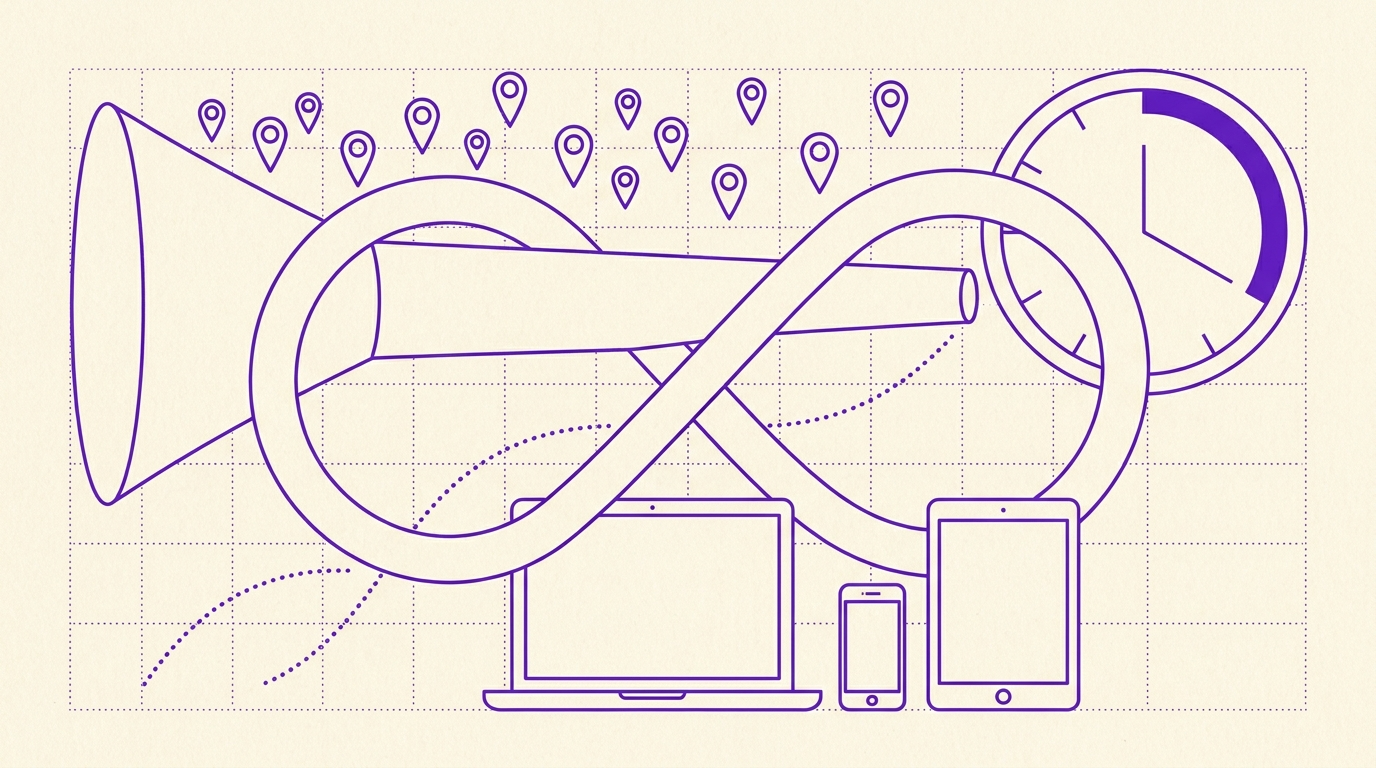
Every share link, to a journalist, a regional team, a client, gets its own live dashboard. The conversion rate column that your campaigns are missing.
Of everyone who opened the link, what share actually downloaded. The one number that says "this landed".
Real reach, deduplicated by visitor, not the same agency producer reloading the page seven times.
When traffic actually arrived. Schedule your next reminder for the hour your audience already shows up.
Where in the world the visits came from. Confirm regional rollouts or spot unexpected interest.
Phone, tablet, laptop. Know whether your share works on the screens it actually meets.
Which channel brought the visit, email, Slack, a calendar invite, an embedded portal.
Conversion rate
Visits that turned into a download. The one number that says “this landed”.
Peak window
9-11 amCET
Schedule the next reminder for the hour your audience already shows up.
Everyone on the team gets a private “My Analytics” view of their own contribution. Admins see roll-ups across the team, never a minute-by-minute log of what Sophie did at 3:47pm.
A GitHub-style daily grid of your own contribution, uploads, edits, downloads, searches. Useful for self-review and quarterly summaries.
How many views, downloads, and searches you generated each day, week, or month. Quietly exportable for an annual review.
A team leaderboard, who uploads, downloads, and searches the most. Recognise contributors, spot training gaps.
Which of the files you uploaded earned the most reach. The portfolio data your performance review never had.
Every night, Freedam looks across views, downloads, searches, and trends, and writes plain-English insights with a priority and a recommended action. The weekly digest writes itself.
Acknowledge, dismiss, or mark as actioned, the dashboard tracks which alerts your team has actually read, so nothing important sinks to the bottom of the pile.
Your team is suddenly hunting for sustainability proof points. Brief the next round of content with this angle in mind, the demand is already there.
Multiple people on the team are looking for EMEA holiday content and finding nothing. Either the assets are mistagged, or you genuinely don't have any.
Roughly 84 GB of storage is sitting on files nobody has touched. Review them in batch, archive, retire, or surface in a curated collection.
Views up 60% week over week. Worth promoting in the brand portal homepage and pinning to the campaign collection.
European marketing teams have heard the analytics pitch before, and the privacy fine print never showed up. Ours is up front.
We turn every IP into a one-way fingerprint at write time. Enough to count unique visitors and detect abuse, never enough to identify a person.
Personal analytics show your own activity. Team analytics show roll-ups and leaderboards, not minute-by-minute behaviour. Insights, not stalking.
Granular events thin out over time. Daily roll-ups stay, raw event rows don't pile up forever. GDPR-friendly by design.
Sensitive actions, downloads, shares, publishes, are recorded against the rights policy version that approved them. Analytics and compliance share one trail.
“We have a DAM” isn't the answer to a CFO question anymore. The follow-up is always, what did we get from it?
"What did we get from the campaign?" used to be a vibe. Today it's a board slide. Asset-level performance turns it into an answer.
The era of "just keep it forever" is over. Knowing what gets used, and what doesn't, is the difference between archiving and re-buying.
What your team types into the search bar is the most honest brief you'll ever get. Mining it should not require a data team.
Your assets travel further than your library. Not knowing whether a share link converted is like running a campaign with no UTM.
Production-grade · Start free today
Bring asset performance, search insight, and share analytics into the same place your library already lives. No new dashboard, no new login, no extra seat.