
Admin Analytics
The Admin Analytics dashboard provides a comprehensive view of how your Digital Asset Management system is being used. It combines real-time visitor telemetry with deep-dive metrics on asset performance and search behavior to help administrators make data-driven decisions about content strategy and system optimization.
This feature is designed for administrators and content managers to track engagement, identify content gaps through AI-generated insights, and monitor the health of the user acquisition funnel.
Page Overview
- Purpose: To provide a centralized hub for monitoring system engagement, content popularity, and search efficiency.
- When to use it: Use this page to audit user activity, identify trending assets for marketing purposes, troubleshoot search terms that return no results, and review AI-driven recommendations for system improvement.
- What you can do here:
- Filter all dashboard data by specific time periods (7, 30, 90, or 365 days).
- Analyze visitor demographics, including browser types, operating systems, and traffic sources.
- Review top-performing and trending assets based on views and downloads.
- Monitor search behavior to identify "Zero Result" searches and most-used filters.
- Act on AI-generated insights regarding content gaps or metadata quality.
- Inspect detailed session activity for specific days.
Who can use it
- The Analytics dashboard is restricted to administrators with the "System Health" admin permission. Standard users, contributors, and non-admin reviewers cannot reach the page.
- The Analytics feature itself must also be included in your current plan - workspaces on plans without Analytics see the Admin menu entry hidden.
Page Layout
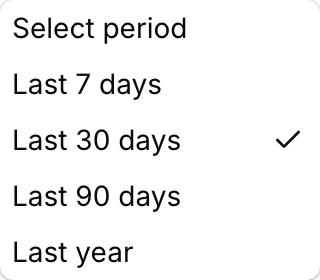
- Top bar: Contains the page title and the Select period (dropdown) filter, which controls the date range for all data displayed on the page.
- Main area: A scrollable dashboard organized into specialized cards:
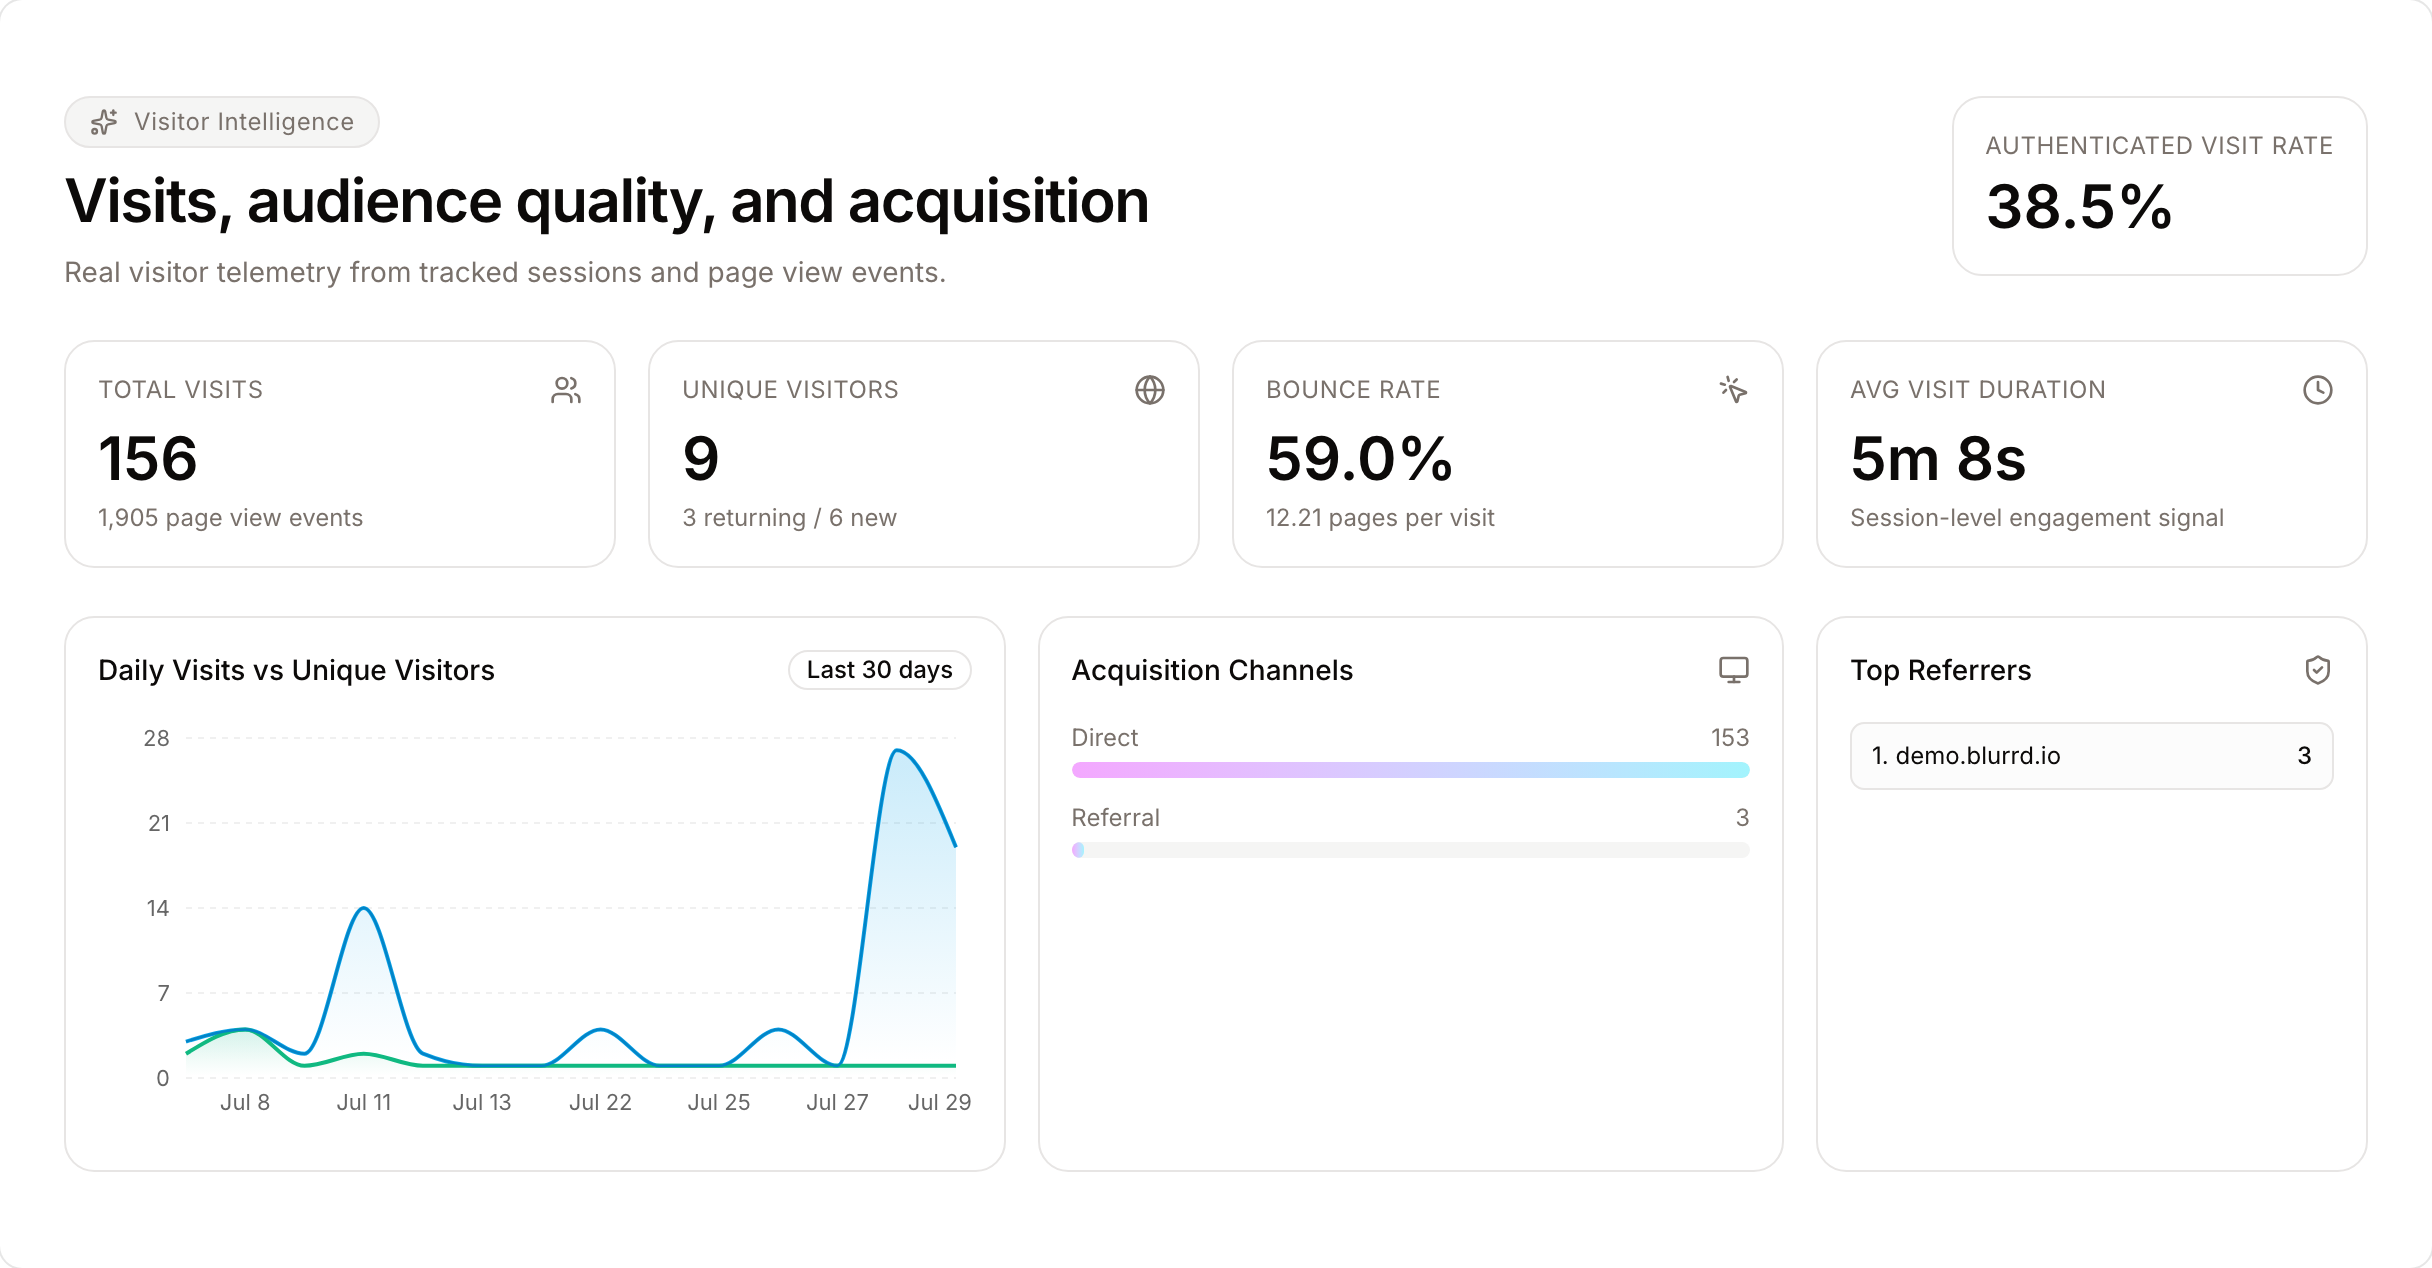
- Visitor Intelligence: High-level metrics for visits, unique visitors, and bounce rates.
- Activity Grids: Visual heatmaps of system activity over time.
- Asset Performance: Visual grids showing top-performing and trending content.
- Search & Filter Analytics: Tables detailing search terms, mode distribution, and filter usage.
- AI Insights: A dedicated table for system-generated recommendations.
- Dialogs: Contextual windows that appear when clicking "View Details" on session rows or interacting with specific assets.
Main Features
Visitor Intelligence
- What it's for: Tracking how users arrive at and interact with the platform.
- Typical use: Checking the "Authenticated Visit Rate" to see how many visitors are logged in versus anonymous.
- Result: Displays charts for daily visits, acquisition channels (where users come from), and top referrers.
- How metrics are calculated:
- Unique visitors are counted by privacy-preserving IP hashes (so the same person across two days still counts once), falling back to distinct session IDs when IPs are not available.
- Returning visitors are those whose IP hash appears in more than one visit during the selected window; new visitors are the remainder.
- Bounce rate counts visits with only one page view that lasted less than 15 seconds.
- Authenticated visit rate is the share of visits where the user was signed in.
- Traffic sources are automatically classified into Direct, Google, Bing, Yahoo, DuckDuckGo, Social (Facebook, Instagram, LinkedIn, Twitter/X, YouTube, TikTok), Email (Gmail, Outlook, etc.) or Referral based on the referring URL.
- Engagement buckets group visits by depth: "1 page", "2-3 pages", "4-7 pages", "8+ pages".
- Top referrers show up to eight external domains (stripping
www.).
AI-Generated Insights
- What it's for: Proactive system auditing using artificial intelligence.
- Typical use: Identifying "Content Gaps" where users are searching for terms that don't exist in your library.
- Result: Provides a list of prioritized action items, such as "Search Optimization" or "Metadata Quality" improvements.
- The 13 insight types Freedam looks for every night: Content Gaps, Declining Assets, Zero-Result Searches, Taxonomy Opportunities, Unused Assets, Unused Taxonomy terms, Missing Variants, User Engagement patterns, Churn Risk, Search Optimization opportunities, Metadata Quality issues, Content Fatigue, and Typo Tolerance suggestions.
- Priority tiers: Insights are ranked Critical, High, Medium, or Low and the table sorts with Critical first. Up to 20 active insights are shown at a time.
- How long insights stick around: Active insights automatically age out after 30 days (marked "expired"). Dismissed or actioned insights are purged 30 days after you act on them, and already-expired ones disappear seven days later.
Search Analytics
- What it's for: Understanding user intent and finding system friction.
- Typical use: Reviewing the "Zero Result Searches" list to see exactly what terms users are typing that yield no content.
- Result: Shows top search terms, average results per search, and the most popular metadata filters being applied.
- Depth of data: The top keywords list shows the 10 most common text searches, the zero-result list shows up to 20 failing terms (with human-readable descriptions when the search was a structured rule), the most-used filter fields list shows the top 10, plus search-mode distribution and the top 10 languages that users searched in.
Asset Performance Tracking
- What it's for: Identifying high-value content.
- Typical use: Sorting assets by "Rising Days" to see what content is currently trending.
- Result: Displays asset thumbnails with view and download counts, allowing you to click through to the full asset record.
- Trending rules: An asset qualifies as "Trending" only after it has shown a rising performance trend on at least 3 different days in the last 7 days. The top 10 trending and top 10 top-performing assets are shown.
- Download breakdown: The resolution breakdown uses the intent recorded at download time, so you can see whether users mostly grabbed thumbnails, previews, web-ready copies, or original-resolution files.
Detailed Feature Documentation
Period Filtering
- Purpose: To restrict the dashboard data to a specific timeframe.
- Where to find it: In the Top bar, look for the dropdown labeled Select period.
- What you'll see: The entire page will refresh, updating all charts, tables, and counts to reflect the chosen duration.
How to use it:
- Click the Select period (dropdown).
- Choose a value (e.g., Last 30 days).
- Wait for the "Analytics Dashboard" to reload with the filtered data.
AI Insight Management
- Purpose: To review and clear system-generated recommendations.
- Where to find it: Scroll to the AI-Generated Insights card in the main area.
- What you'll see: A table listing the insight type (e.g., "Content Gap"), priority level, and a description with recommended actions.
How to use it:
- Locate an insight you wish to address.
- Click the Recommended Actions (expandable) link to see specific steps.
- Once addressed, click the Dismiss insight (X button) at the end of the row.
- A notification "Insight dismissed" will appear.
Session Detail Inspection
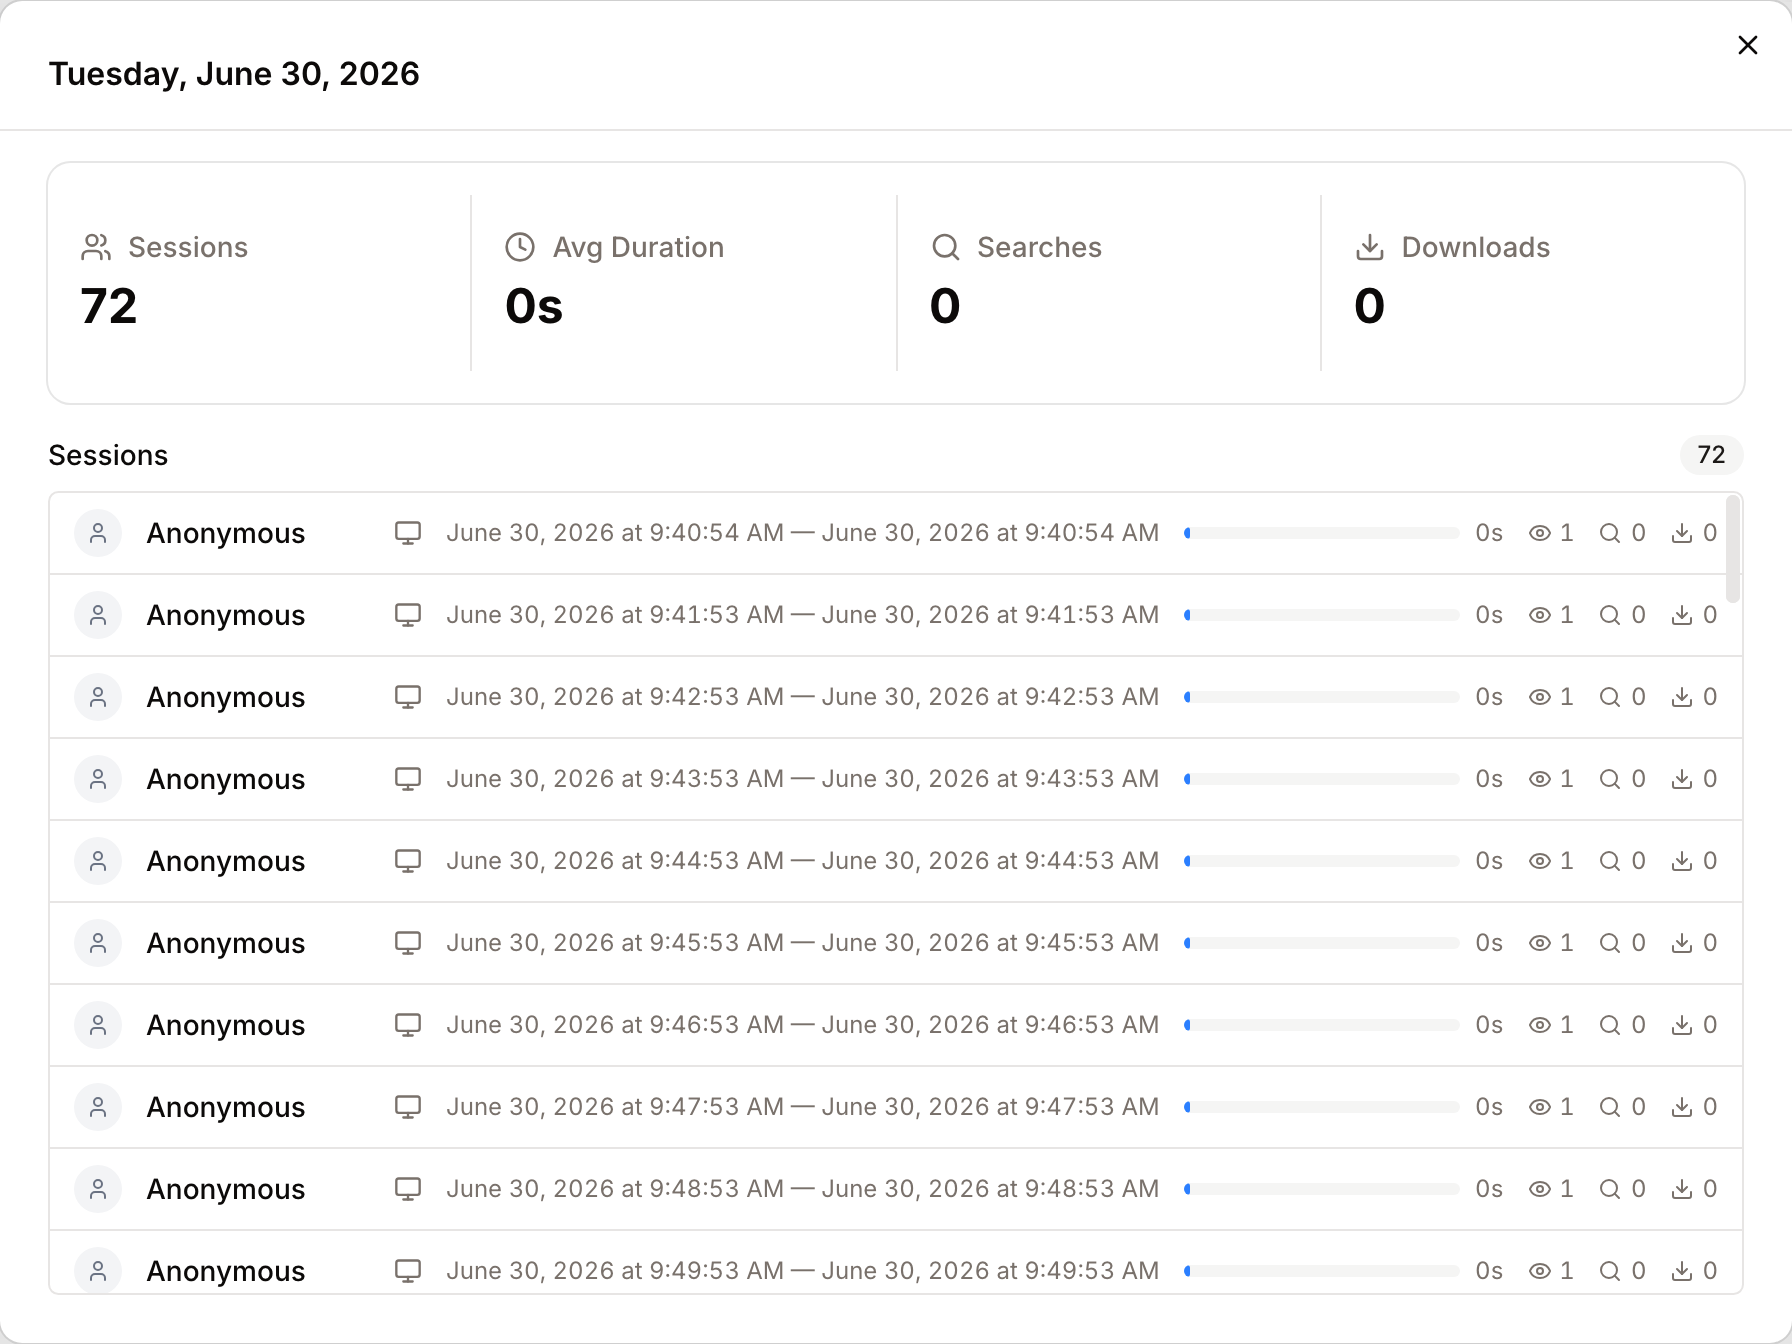
- Purpose: To view granular activity logs for a specific calendar day.
- Where to find it: In the Session Vision Over Time table, look for the View Details button.
- What you'll see: A dialog opens showing session counts, average session time, and specific user activity for that date.
How to use it:
- Scroll to the Session Vision Over Time card.
- Find the date you want to investigate.
- Click View Details.
- Review the data and click Cancel or the Close (X) icon to return to the dashboard.
Complete Workflows
Workflow: Identifying and Fixing Search Friction
- Goal: Find out what users are looking for but cannot find.
- Prerequisites: Admin permissions to view Analytics.
Steps:
- Navigate to the Admin Analytics page.
- Scroll down to the Zero Result Searches card.
- Review the Search Term column to identify common themes.
- Look at the Count column to see how many times that specific term failed.
- Click on the AI-Generated Insights card to see if the system has already suggested a "Content Gap" or "Taxonomy Suggestion" for these terms.
- Use these terms to inform your next content upload or to adjust existing asset tags.
- Expected result: You identify specific keywords that require new content or better metadata.
Workflow: Analyzing Content Popularity for Reports
- Goal: Export or report on the most successful assets in the last month.
- Prerequisites: Access to the Analytics dashboard.
Steps:
- Select Last 30 days from the Select period (dropdown).
- Locate the Top Performing Assets card.
- Observe the view and download counts displayed under each asset thumbnail.
- Locate the Trending Assets card to see content with "Rising Days" (indicated by green arrows).
- Click any asset thumbnail to navigate to its detail page for further action.
- Expected result: A clear visual and numerical representation of your most valuable content.
What happens behind the scenes
- Nightly insight generation: Every night at 3:00 AM your workspace runs the full AI insights pipeline across all 13 insight categories. Newly-surfaced issues appear on the dashboard the next morning.
- Session hygiene: User sessions are closed automatically after 30 minutes of inactivity. This sweep runs every 15 minutes, so session-length and "session count" figures stay accurate even if visitors simply close their browser without logging out.
- Daily performance aggregation: Each night at 2:00 AM Freedam rolls up the day's asset views, downloads, and share events into a per-day performance table. This is what powers the "Rising Days" counter and the long-term trending view. Workflow metrics are aggregated 15 minutes later.
Data retention
- Raw visitor activity and searches are kept for 1 year before being purged.
- Session-level records are kept for 90 days of detail, and deleted entirely after 1 year.
- Daily asset performance snapshots are kept for 2 years for historical comparisons.
- Expired or already-acted insights are removed 7 to 30 days after they stop being useful.
- The full purge runs every Sunday at 5:00 AM, so your dashboard never grows unbounded.
Good to know
- Dashboard freshness: To keep the page fast, the main analytics views are cached for 15 minutes per period selection. If you've just acted on something and want fresh numbers, reload the page after 15 minutes (or dismiss an insight, which clears the cache immediately).
- Anonymous activity is preserved: Searches, sessions, and downloads from unauthenticated visitors are grouped under an "Anonymous" entry in the Most Active Users table when any anonymous activity was recorded in the period.
- Session detail dialog: The day-level drill-down reconciles three different sources (the session table, event records, and search records) so even visits that ended without an explicit logout still appear with a computed duration.
- Period flexibility: Any value between 1 and 365 days is accepted. Values outside that range fall back to 30 days.
Tips and Best Practices
- Check the Heatmap: Use the Activity by Day grid to identify peak usage times. Darker or warmer colored squares indicate higher activity, helping you schedule system maintenance during low-traffic periods.
- Monitor Bounce Rate: If the Bounce Rate in Visitor Intelligence is high, review your "Top Referrers" to see if external links are sending users to the wrong landing pages.
- Act on Insights: AI Insights are prioritized. Focus on "High" priority items first, as these typically represent significant content gaps or metadata issues affecting search.
- Compare periods: Switching between 7, 30, 90, and 365 days is the fastest way to spot whether a change is a blip or a genuine trend - each period is cached independently so switching back is instant.
Troubleshooting
Issue: Dashboard shows "No data available" or "No visitor data"
- Symptoms: Cards display an icon with text like "No visitor data" or "No trending assets."
- Cause: There is no recorded activity for the selected time period.
- Fix: Try selecting a longer timeframe (e.g., Last 90 days or Last year) from the Select period (dropdown).
- Prevention: Ensure that user tracking is enabled and that users are actively interacting with the site.
Issue: Failed to dismiss insight
- Symptoms: Clicking the X button on an AI Insight results in an error toast saying "Failed to dismiss insight."
- Cause: Temporary network interruption or session timeout.
- Fix:
- Refresh the page.
- Attempt to click the Dismiss insight (X button) again.
- If the issue persists, check your internet connection.