
Sustainability Dashboard
The Sustainability Dashboard provides a transparent look at the environmental cost of your digital asset management. Every file stored and every megabyte downloaded requires electricity; this feature estimates the resulting carbon footprint for both your individual activity and your entire organization.
By visualizing data through intuitive "Impact Trees" and "Rendition Forests," you can identify areas where storage is being wasted and take actionable steps, such as pruning unused assets, to reduce your digital CO₂ emissions.
What the numbers actually measure
- Storage impact is calculated from how many gigabytes you own, multiplied by a per-GB-per-year CO₂ factor, then pro-rated for the window you're viewing.
- Transfer impact is calculated from the gigabytes moved during downloads and previews, multiplied by a per-GB bandwidth factor.
- Equivalences translate each kilogram of CO₂ into relatable units - roughly 8.3 km driven by an average petrol car, 3.6 kWh of grid electricity, or the amount a tree absorbs in about three weeks.
Workspace admins can override the default factors per-tenant, so your organization's dashboard may use figures tuned to your hosting region.
How often the numbers refresh
Totals, trends and the rendition breakdown are cached for five minutes. If you've just deleted a lot of files or run a big download and don't see the change straight away, give it a few minutes and refresh. The daily trend chart updates once per day, and the orphan report is regenerated roughly once per week.
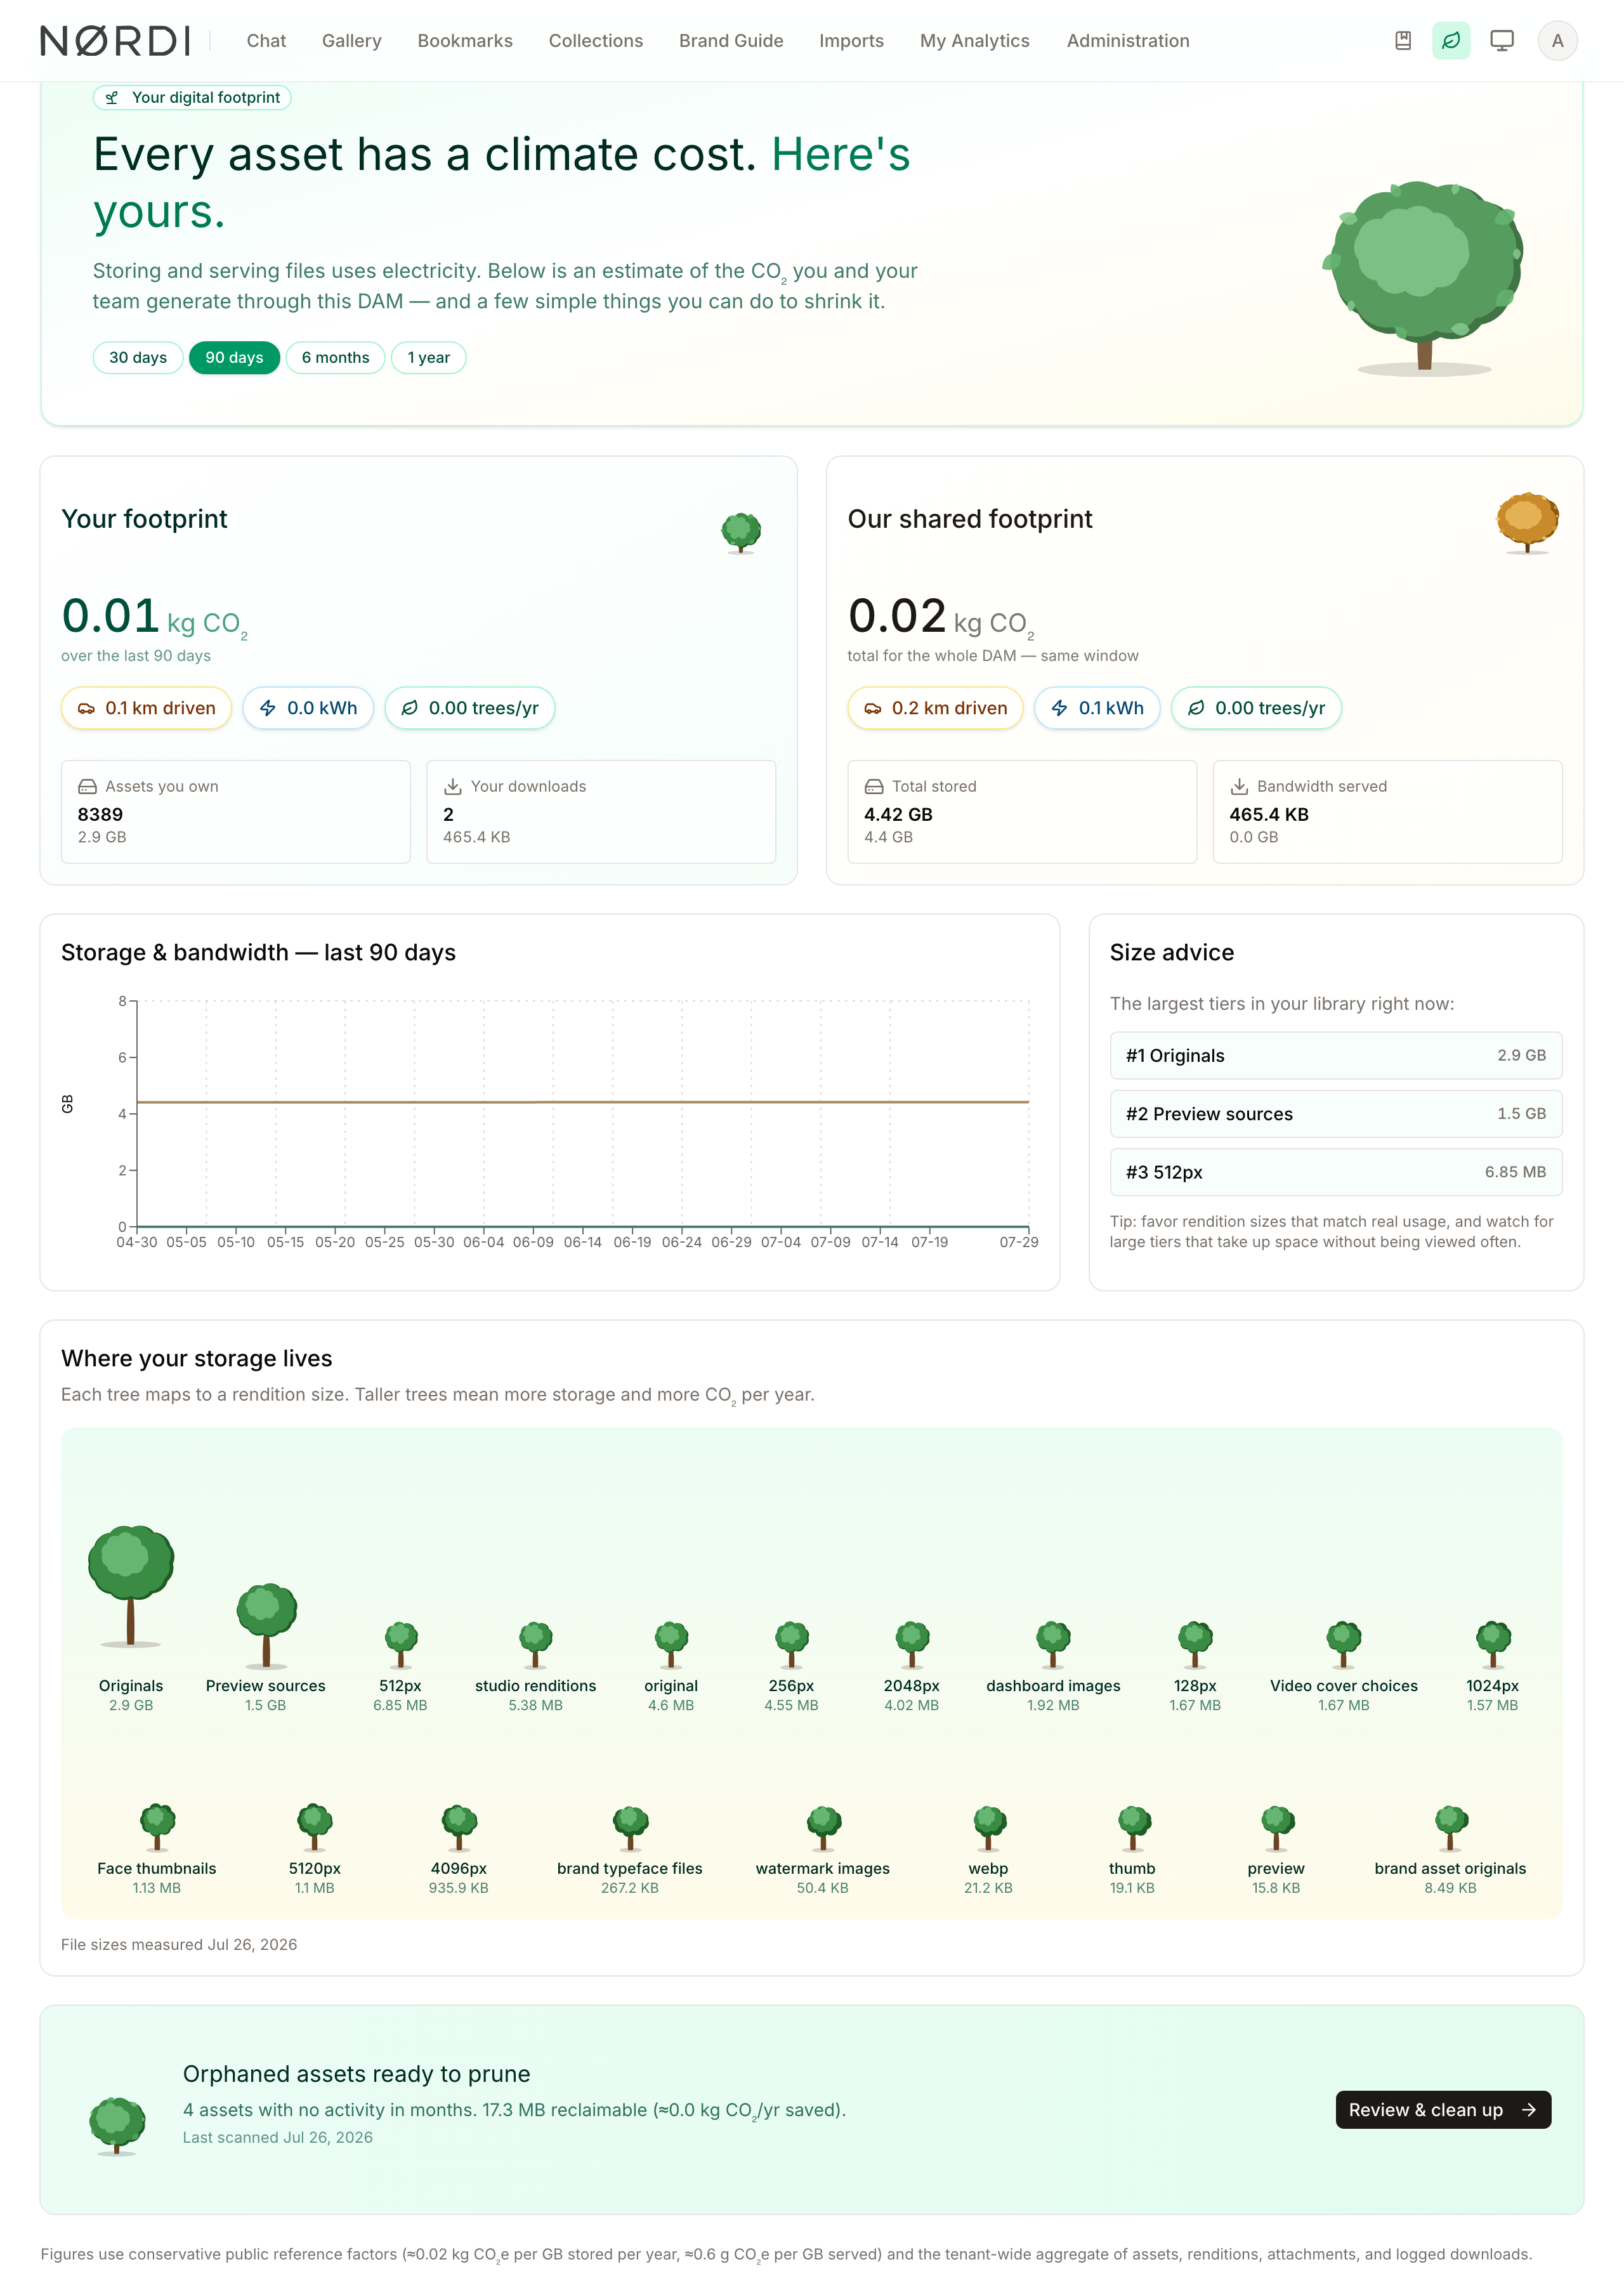
Page Overview
- Purpose: To quantify the environmental impact of digital storage and transfer.
- When to use it: Use this page to audit your storage growth, compare your impact against the organization's total, and identify opportunities to save energy by deleting unnecessary files.
- What you can do here:
- View your personal CO₂ footprint based on assets you own and download.
- Compare your impact to the shared organization-wide footprint.
- Adjust the reporting window to see trends over different time periods.
- Identify which file sizes (renditions) are consuming the most storage.
- Access cleanup tools for "orphaned" assets that are no longer in use.
Page Layout
- Top bar: Displays the "Your digital footprint" badge and a time-range selector to filter data by 30 days, 90 days, 6 months, or 1 year.
- Main area: Contains the primary data cards for personal and shared footprints, followed by a trend chart for storage and bandwidth.
- Lower section: Features the "Rendition Forest" visualization, a "Size advice" panel for storage optimization, and the "Orphaned assets" cleanup teaser.
Main Features
Time Range Selector
- What it's for: Filtering all dashboard data to a specific historical window.
- Typical use: Switching from the default 90-day view to a 1-year view to see long-term growth.
- Result: All statistics, charts, and impact trees update to reflect the selected duration.
Impact Trees & Equivalences
- What it's for: Translating abstract CO₂ kilograms into relatable real-world data.
- Typical use: Checking how many "kilometers driven" or "trees per year" your digital activity equates to.
- Result: Displays visual tree icons that grow larger as impact increases, alongside chips showing car travel, energy (kWh), and tree absorption equivalents.
Rendition Forest
- What it's for: Visualizing which file versions (e.g., Thumbnails vs. Originals) occupy the most space.
- Typical use: Identifying if high-resolution "Extra large" previews are consuming more space than the original files.
- Result: A grove of trees where taller trees represent larger storage tiers.
Orphaned Assets Pruning
- What it's for: Identifying files that have had no activity for months and can be safely deleted.
- Typical use: Reclaiming storage space and reducing ongoing CO₂ costs by removing "dead" files.
- Result: Shows the total reclaimable GB and the estimated CO₂ savings per year.
By default, Freedam flags an asset as "orphaned" when it has had zero activity for 180 days; the threshold is configurable for your workspace. The Review & clean up button is only visible to users with permission to delete assets - everyone else sees a message prompting them to ask an administrator.
Detailed Feature Documentation
Footprint Comparison Cards
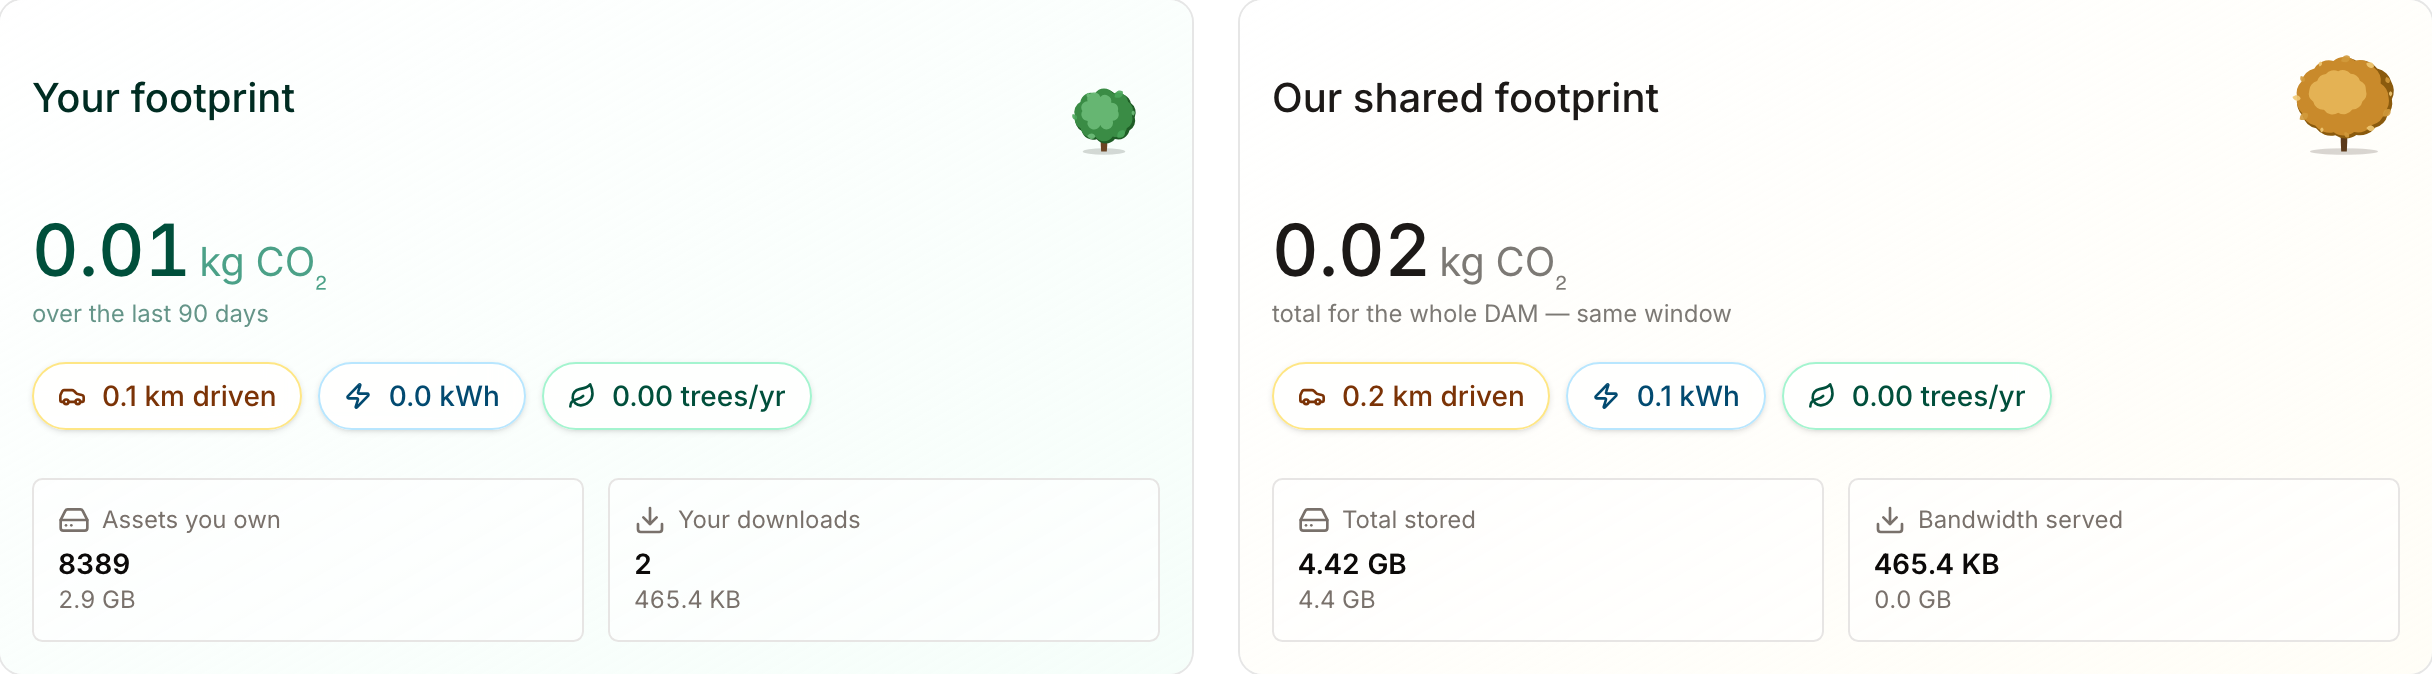
- Purpose: To show a side-by-side comparison of your individual impact versus the total organization impact.
- Where to find it: In the main area, look for the "Your footprint" and "Our shared footprint" cards.
- What you'll see: Total kg of CO₂, number of assets owned, and total bandwidth served.
How to use it:
- Locate the Your footprint card to see assets you personally uploaded.
- Review the StatRow icons for Assets you own and Your downloads.
- Compare these figures to the Our shared footprint card to see your percentage of the total impact.
Storage & Bandwidth Trend Chart
- Purpose: To track how storage and data transfer fluctuate over time.
- Where to find it: In the middle of the page, under the heading "Storage & bandwidth".
- What you'll see: A line graph showing storage growth and a shaded area graph showing bandwidth (transfer) usage.
How to use it:
- Hover your mouse over any point on the chart.
- View the tooltip to see the exact Storage (GB), Transfer (GB), and CO₂ (kg) for that specific date.
- Look for spikes in the green shaded area to identify days with high download activity.
Orphaned Assets Cleanup
- Purpose: To reduce environmental impact by deleting unused files.
- Where to find it: At the bottom of the page in the "Orphaned assets - ready to prune" section.
- What you'll see: A summary of assets with no activity and a button to review them (if permitted).
How to use it:
- Check the summary text to see how many assets are "orphaned."
- Note the reclaimable size and the kg CO₂/yr saved estimate.
- Click Review & clean up (if available) to manage these assets.

Complete Workflows
Workflow: Optimizing Storage Tiers
- Goal: Identify which file renditions are wasting the most space to consider more efficient formats.
- Prerequisites: None.
Steps:
- Scroll to the Where your storage lives section.
- Identify the tallest tree in the Rendition Forest.
- Look at the Size advice list to the right to see the top 3 largest tiers.
- Note the specific tier name (e.g., Extra large (2048px)).
- Expected result: You identify which preview sizes are the primary drivers of storage costs.
Workflow: Reclaiming Space from Unused Assets
- Goal: Delete assets that are no longer being used to lower the organization's carbon footprint.
- Prerequisites: You must have "Delete" permissions (Administrator access).
Steps:
- Navigate to the Sustainability Dashboard.
- Scroll to the bottom section titled Orphaned assets - ready to prune.
- Click the Review & clean up button.
- Follow the prompts on the subsequent page to confirm deletion of inactive files.
- Expected result: The total storage count decreases and the "reclaimable" estimate in the dashboard resets after the next weekly scan.
Tips and Best Practices
- Check Weekly: Orphan reports are generated once a week. Check back every Monday to see if new assets have been flagged for pruning.
- Format Efficiency: If your "Originals" tree is significantly taller than others, consider uploading files in more efficient formats like WebP or AVIF to reduce the baseline footprint.
- Window Comparison: Compare the "30 days" view to the "1 year" view to see if your sustainability efforts are trending downward over time.
Troubleshooting
Issue: The "Review & clean up" button is missing
- Symptoms: You see a message saying "Ask an administrator to run the cleanup" instead of a button.
- Cause: Your user account does not have the required permissions to delete assets.
- Fix: Contact your system administrator to request access or ask them to perform the cleanup.
Issue: "No orphan report yet" message
- Symptoms: The Orphaned Assets section shows no data and says "Come back next week."
- Cause: The system has not yet completed its first weekly scan of your asset library.
- Fix: Wait for the "Last scanned" date to update, which typically happens once every seven days.
Issue: Data seems outdated
- Symptoms: Recent uploads or downloads aren't reflected in the CO₂ totals.
- Cause: Sustainability metrics are calculated periodically and may not reflect real-time activity instantly.
- Fix: Refresh the page or check back after 24 hours for the daily trend to update.