
System Health
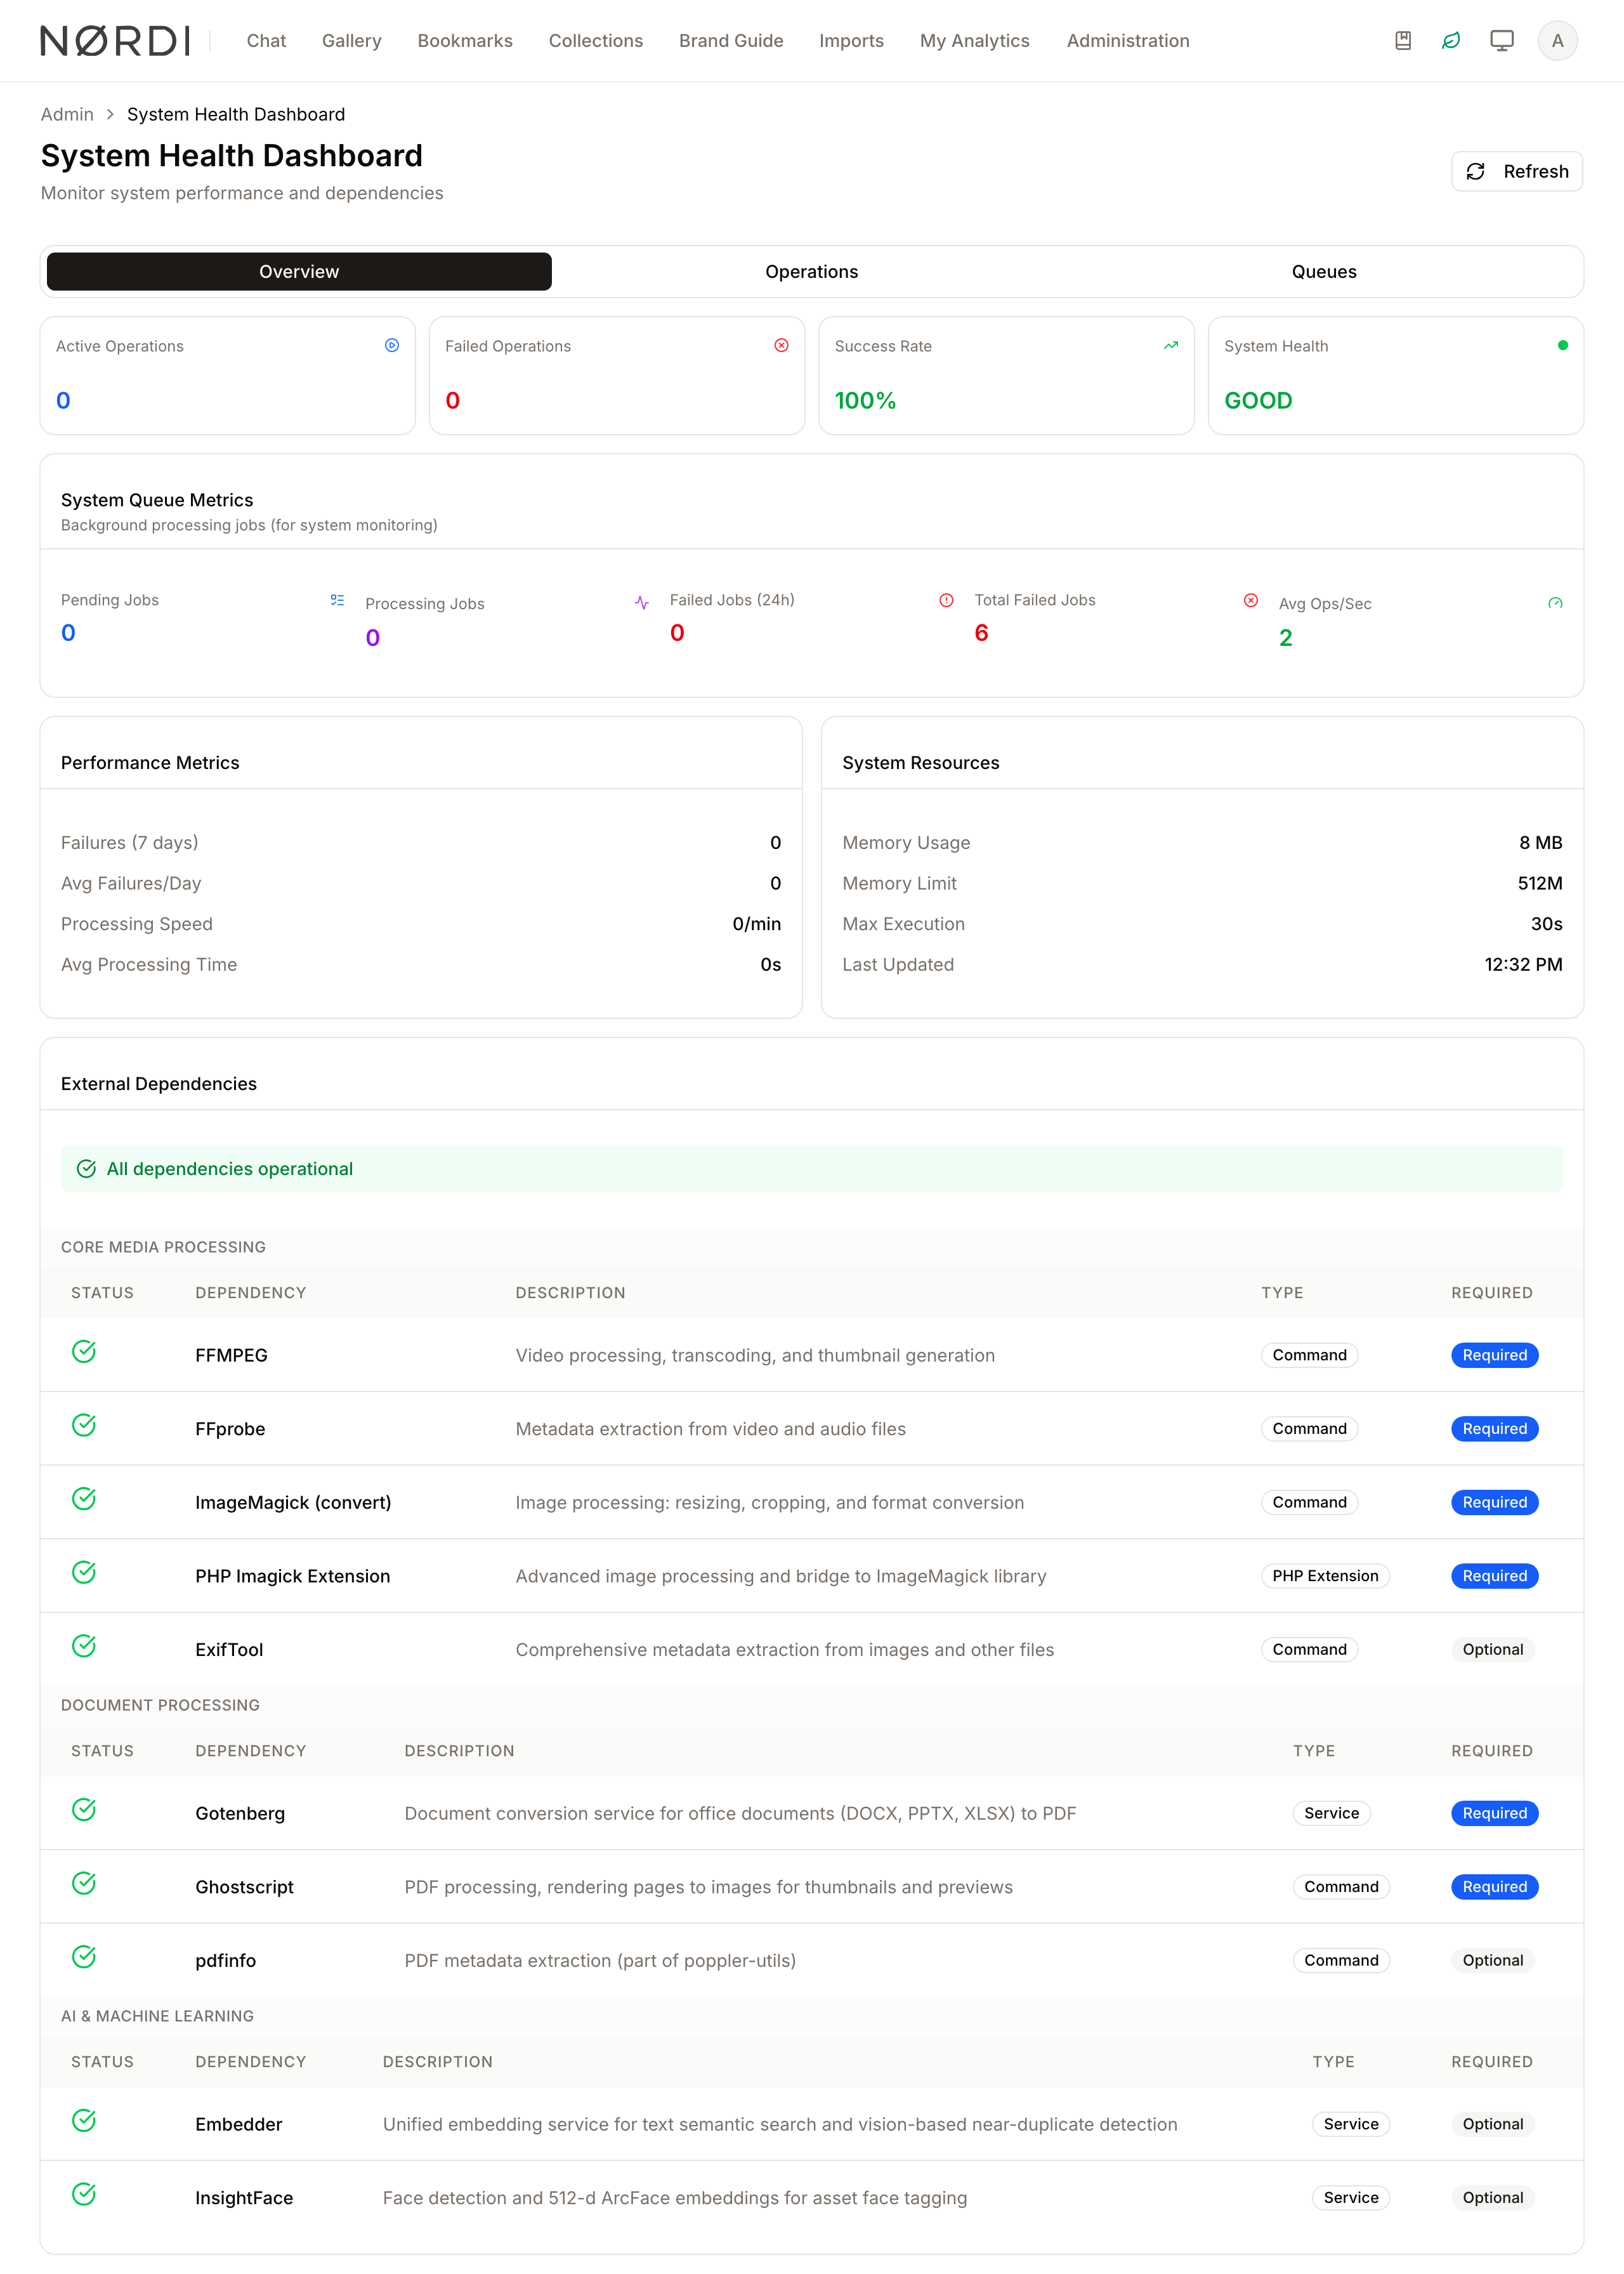
The System Health dashboard provides administrators with a real-time overview of the Freedam environment. It serves as a central hub for monitoring background processing, server resource utilization, and the status of external service dependencies.
This feature is essential for troubleshooting performance bottlenecks, verifying that automated tasks (like asset ingestion or metadata updates) are completing successfully, and ensuring all required system components are operational.
Page Overview
- Purpose: To provide visibility into the technical state of the application and the progress of long-running background tasks.
- When to use it: Use this page when checking if the system is under heavy load, investigating why an asset hasn't finished processing, or confirming that server resources are within healthy limits.
- What you can do here:
- View high-level success rates for system operations.
- Monitor background queue volumes and processing speeds.
- Audit and manage bulk metadata updates and ingestion batches.
- Check the status of required services like PHP extensions and system commands.
- Export operation logs for external reporting.
Who can use it
The System Health dashboard is reserved for system administrators. The page, its metrics, the operations list, the cancel and retry actions, cleanup of old operation history, and the CSV export are all gated behind a dedicated system-health privilege, so regular contributors and reviewers do not see it in the admin menu.
Page Layout
- Top bar: Displays the "System Health Dashboard" title and description. Contains the Refresh button to update metrics and the Export button (when on the Operations tab).
- Navigation Tabs: A central toggle to switch between the Overview, Operations, and Queues views.
- Main area: The primary content zone that changes based on the selected tab, featuring metric cards, filter controls, or data tables.
- Dialogs: Pop-up windows used for confirming operation cancellations or viewing granular details of a specific background task.
Main Features
System Metrics & Resource Monitoring
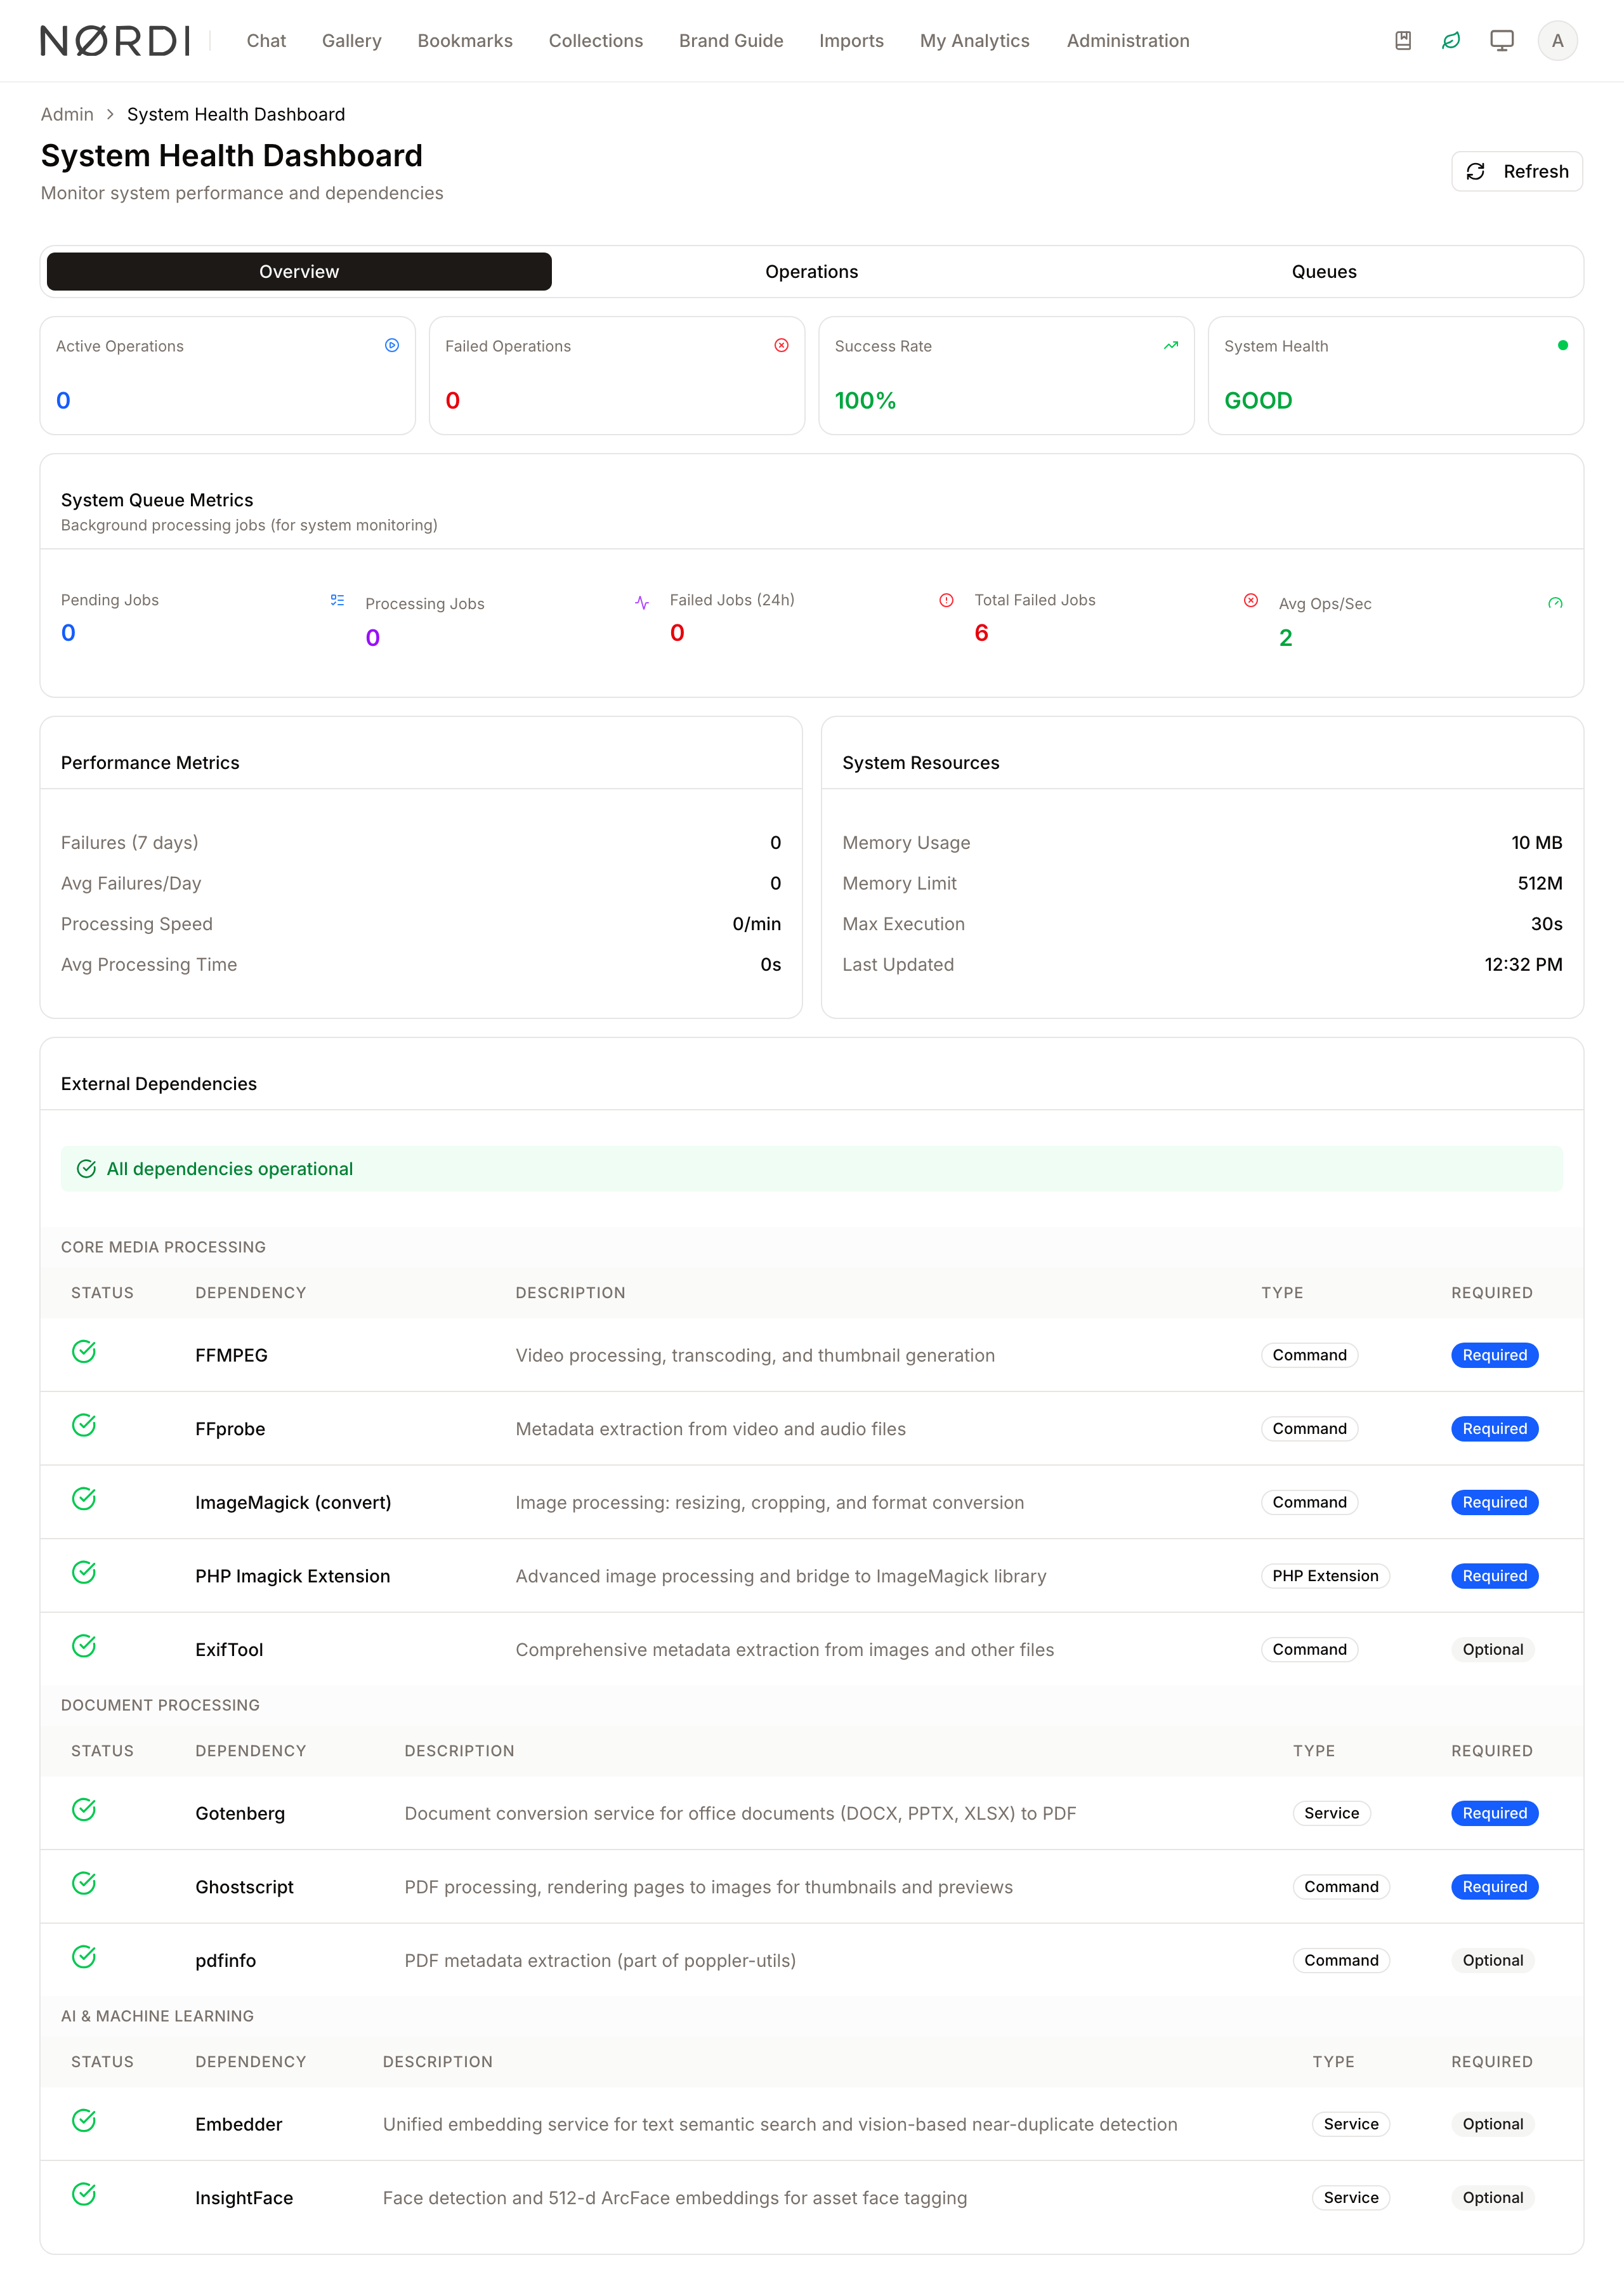
- What it's for: Tracking server-side health including memory usage, execution limits, and processing speeds.
- Typical use: Checking if the "System Health" status is "GOOD" or if it requires "ATTENTION" due to recent failures.
- Result: Provides immediate feedback on whether the infrastructure is supporting the current user load.
Operations Management
- What it's for: Tracking the lifecycle of bulk tasks like asset ingestions and metadata changes.
- Typical use: Finding a specific batch by ID or User to see why it is stuck or failed.
- Result: Allows administrators to see exactly how many assets succeeded or failed within a specific job.
Dependency Verification
- What it's for: Ensuring all external tools and services required by Freedam are connected.
- Typical use: Verifying that "Required" services are marked with a green checkmark after a system update.
- Result: Identifies missing PHP extensions or system commands that might be disabling specific features.
Detailed Feature Documentation
Operations Filtering and Export
- Purpose: To locate specific background tasks and download history for auditing.
- Where to find it: Click the Operations tab, then look for the Filters card.
- What you'll see: A list of operations filtered by your criteria, with the ability to download the results as a CSV.
How to use it:
- Select a status (e.g., "Failed") from the All Statuses dropdown.
- Select a type (e.g., "Asset Ingestion") from the All Types dropdown.
- Click the Date from or Date to buttons to select a timeframe from the calendar.
- Click Apply to update the list.
- Click Export in the top bar to download the filtered list.
Operation Detail View
- Purpose: To inspect the progress, timeline, and specific errors of a single operation.
- Where to find it: In the Operations table, click the View details (eye icon) button next to any entry.
- What you'll see: A dialog showing a progress bar, a timeline (Created vs. Started vs. Completed), and a list of individual asset results.
How to use it:
- Locate the operation in the list.
- Click the View details icon.
- Scroll to Asset Results to see which specific files failed and why (e.g., "Metadata Extraction" stage reached).
- Click Close to return to the main list.
Complete Workflows
Workflow: Troubleshooting a Failed Bulk Update
- Goal: Identify why a metadata update didn't apply to all assets.
- Prerequisites: Administrator permissions.
Steps:
- Click the Operations tab.
- Locate the operation with the status PARTIAL or FAILED.
- Click the View details button (eye icon).
- Look at the Error Message section for a general system error.
- Scroll to the Asset Results table to see the User-friendly message for each failed file.
- If the operation is a Bulk Metadata type and has failed, click the Retry button (refresh icon) in the main table to attempt the process again.
- Expected result: The detail dialog reveals specific reasons (like "File Storage" errors) for the failure.
Workflow: Monitoring Queue Health
- Goal: Check if background tasks are backing up.
- Prerequisites: Access to the System Health dashboard.
Steps:
- Click the Queues tab.
- Review the Queue Job Categories grid.
- Look for categories with a blue pending count or a red failed count.
- Check the System Queue Metrics on the Overview tab to see the Avg Ops/Sec.
- Expected result: If "Pending Jobs" is high and "Avg Ops/Sec" is low, the system is currently experiencing a processing delay.
What is being checked behind the scenes
The External Dependencies panel on the Overview tab rolls up a number of real-time checks against the tools Freedam relies on. They are grouped so you can tell at a glance which area of the product is affected:
- Core media processing - video and audio handling (FFmpeg and its companion probing tool), image processing and thumbnailing (ImageMagick plus its PHP bridge), and, optionally, the ExifTool metadata reader.
- Document processing - the document-to-PDF conversion service that turns Office files and other documents into previewable PDFs, plus PDF rendering and PDF metadata tools.
- AI and machine learning - the text and vision embedding service that powers semantic search and near-duplicate detection, and the face-recognition service that tags people in your photos.
- System security - the virus scanner that inspects every incoming upload. Its availability is probed live when uploads happen; if it goes offline, ingestions pause rather than accept unscanned files.
- Background workers - the queue workers that run asset ingestions, previews, metadata extraction, AI analysis, face detection, document conversion, search indexing, workflows, analytics, and outbound emails.
Each item is labelled "Required" or optional. Required items are essential for everyday operation; optional items only disable the specific feature they power (for example, face recognition or semantic search) while the rest of the platform keeps working.
How the queue categories are organised
The Queues tab groups jobs into human-readable categories so you can see where any backlog or failure is coming from. Typical categories include:
- Ingestion Pipeline - everything involved in accepting a new upload and creating an asset.
- Metadata Processing - technical details like EXIF data, PDF text extraction, and perceptual hashes for duplicate detection.
- AI Enrichment - AI-powered tagging, captions, and chat title generation.
- Preview Generation - thumbnails, focus-point detection, and on-the-fly conversions.
- Search and Indexing - keeping the search engine current as assets, collections, vocabularies, and metadata change.
- Bulk Operations, Workflows, Pages, Emails, Analytics, and Utilities - the remaining automated work the platform does on your behalf.
Empty categories are hidden automatically so the view always reflects what's actually happening now.
Good to know
- Success rate and throughput numbers focus on the last seven days of completed work; if nothing ran in that window the page automatically widens the lookback to thirty days so the figures remain meaningful.
- Cancel is only available while an operation is still in progress; retried operations appear as a new entry linked to the original failure.
- Cleanup of old operations removes completed, failed, and cancelled records older than a number of days you choose, and offers a preview mode that tells you how many rows would be deleted before committing.
- The CSV Export mirrors whatever filters you've applied to the Operations list, so you can share or archive a specific slice without exporting everything.
Tips and Best Practices
- Regular Refreshes: The dashboard does not auto-update every second. Use the Refresh button in the top bar to get the latest metrics during active ingestions.
- Check Dependencies First: If features like AI analysis or preview generation aren't working, check the External Dependencies section on the Overview tab first to ensure the required services are operational.
- Date Range Validation: Ensure your "Date from" is earlier than your "Date to"; the system will highlight the fields in red if the range is invalid.
Troubleshooting
Issue: Operation stuck in "Processing"
- Symptoms: The progress percentage hasn't changed for a long period.
- Cause: A background worker may have timed out or the server reached its memory limit.
- Fix: Check System Resources for memory usage. If it is a Bulk Metadata operation, you can click the Cancel button (X icon) and then Retry.
- Prevention: Avoid running extremely large batches during peak server usage times.
Issue: "Critical dependency missing" warning
- Symptoms: A red status bar appears at the top of the Dependencies section.
- Cause: A required system command or PHP extension is not installed on the server.
- Fix: Note the name of the dependency (e.g., a specific "Service" or "Command") and contact your system administrator to install the missing component.
- Prevention: Review the Dependencies list after any server migration or environment update.